This is a post in response to this month's #blogsync topic of "Progress in my classroom? How it is made and how I know it." To see all other posts in this month's #blogsync go to:
http://blogsync.edutronic.net/As this month's topic is all about progress in my classroom it has allowed me to reflect on what and how I have been doing with a number of my classes over the course of the year and to see whether indeed my classes are making progress.
As a lot of posts in this month's #blogsync have already pointed out there is not just progress to be had in a single lesson, but also over a longer, more sustained, period of time. It is the latter that I will talk about here as I feel for some (if not all) of my groups this is more important.
I will discuss 3 different ways in which I have seen progress with my classes, using 3 different methods of recording such progress. The first will be with my low-ability (bottom set) year 8 classes, the second will be with my year 9 top set and the third and final example will be from my year 10 set 2 class that are sitting the first of their GCSE Mathematics examination in June this year.
Year 8s (both set 5s on either side of the year) - Times Tables!When I was given both of the set 5 year 8 classes to teach this year there was one thing that became apparent fairly early on - they were really weak with their times tables. This was mentioned in all of the students' reports at the end of year 7 by their class teacher and was evident in my 1st few lessons with both groups. So, in an attempt to make my students become better with these very important basics I decided to continually test them on their times tables and give them regular practice with them. How I do this is by getting them each, throughout our lessons, to complete the Interactive Times Tables 'game' that I found on the TES. The resource can be downloaded
here. Now, I don't do this every lesson with the classes as too much of anything gets stale, but we do them at least once I week, on average, I would say. The students love doing them and often request to do them/ask if we will be doing them in lesson.
The advantage I have of having the bottom sets is that I only have 9 students in one set and 12 in the other. This means that the task does not interrupt our 'normal' lesson activities. I simply, whilst the class are working on the task given in that particular lesson, randomly call them up to the IWB to do the times tables 'game'. The game gives each student 1 minute to answer as many times tables (up to 12 x 12) as they can. Each question gives 6 possible answers to chose from, which for the set 5s is nicely differentiated. At the end of the minute I record their scores in my markbook and then call the next student up until all have had a go.
Then, crucial to the success of the task for this long a time, I give VIVOs (our schools rewards) to all those students that have improved their score by 3 or more, and then give the top 3 an extra VIVO each. This 'progress' is clear for all to see and I read out and congratulate those students that have made the 3 or more points progress from the previous go.
I have created a simple spreadsheet from all the lessons we did this in up to December 2012 and you can see a print screen of the results below...

I have highlighted 'student 4' above as this is the weakest student I teach in either of the 2 sets. This student didn't get a single times table correct in the minute given in his first ever go at it. Since then, the student is regularly getting over 10 a minute correct. Now, some might say that the familiarity with the task would naturally aid this, but for him it is a massive step forward. He has gained confidence with not only his times tables, but getting up in front of his peers and not being afraid to make mistakes, or be getting a lower score than others - and the rest of the class are surprisingly supportive of him and his quest to improve his score. I then created a graph of the class' average scores and you can see how this has improved since the start of the year. There are some dips here and there, and Mathematics is no straight line of progression from start to finish. Some of these 'dips' happen straight after school-holidays and this is a good excuse to remind the students of the need to keep practising them.
This, for my lower set year 8 classes is great progress. Especially as it was the one key thing they needed to improve on from year 7. They have all made progress over time, no matter how small and I'm starting to see now a greater ability for them to perform other tasks, and at a much higher speed than before. For example, when working out the area of rectangles they are able to relate this to the times tables 'game'.
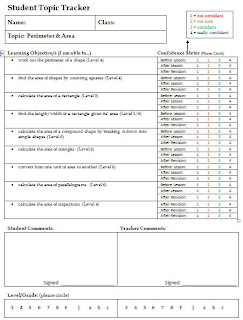
Year 9 - Student Topic TrackersIn order for me to show progress in my Year 9 set 1 lessons I regularly have used my student topic trackers. I posted previously on the use of these
here.
The topic trackers are a great way of showing 'progress' with the students' confidence from the start of the lesson to the end. On the topic trackers I split out all of the learning objectives for the series of lessons I will teach them on that topic. The lesson objectives progress in terms of their levels as you go down the sheet. For each objective there is then a 'before lesson', 'after lesson' and 'after revision' section for them to rate (on a scale of 1-4) their confidence with the lesson objective/s. This lesson based progress-o-meter is a good way of me seeing if the students have understood and feel more confident than they did at the start of the lesson.
Equally, from topic to topic, it is a good way of me seeing the progress they are making throughout the year. At the end of each topic I get the students to give themselves a level based on the topic trackers and the lesson objectives they feel most confident in and their respective levels. Then, from topic to topic I record, again in my markbook, the levels both the students give themselves and the levels I give them based on end of topic tests and h/w scores.
The topic trackers are then used for the students revision to go over those lesson objectives that they perhaps weren't so confident with. I can see these coming into play much nearer the end of the year when they will sit a GCSE linear paper prior to being setted for Year 10.
Here's an image of one of the topic trackers...
There have been a few suggestions from members of staff at my school as to how I could improve the use of these. The first would be to take their books in and do my 'teacher's comment' half-way through the topic, to make the feedback to them more useful perhaps as they go throughout the topic and be a bit more formative. The second is that they take quite a while to sit down and do the teacher's comments in the first place, so for every topic to cover in a year this could become too much. They do indeed take a lot of marking, is it worth it - yes, I think it is. Could the process be sped up somehow - I don't know yet. I have recently stopped using them with the class due to some topics we have covered being merely a 'refresher' lesson as the class would have covered it in previous year groups and so the topic tracker hardly felt relevant here. However, for those 'new' topics, or those that require a series of lessons to teach I will still continue to use them as I feel they are a good way of the students seeing the progress they are making - even if, as some would surely argue, it is only with their confidence and no concrete evidence of them actually making progress with the objectives. However, I would counter that by saying the 'after lesson' scale gets filled in in the 'plenary' part of our lessons having tested the students knowledge with an appropriate task. My teacher's comment and level are then based on the class work throughout the topic/objectives and their end of topic tests.
Year 10 - GCSE Mock GradesIn order to see if my Year 10s are making progress I have relied mainly on them completing GCSE mock papers and comparing the grades with their targets.
The class, to date, have done 2 official mock exams (Unit 1 [non-calc]) - 1 in January (straight after the holidays) and 1 at the end of February. They will sit one soon too by doing the Unit 2 paper (Calc), which will give me a further indication of their progress to date.
These results have given me a good idea of progress that has been made (if any) and the 'gap' still to close to their target grades.
Following the class' February mock, which was done in examination style conditions with the rest of the year group in the school hall, I showed them this notebook slide at the start of the lesson where I gave them their results back...
The 3 bar charts show (from left to right) the results from the January mock, the results from the February mock, and the class' target grades.
From the January mock the progress the class made was clear to see. We went from having 9 Ds, 18 Cs and 3 Bs to...6 Ds, 16 Cs and 8 Bs. There is still a notable jump to get the class to their target grades, but these are targets for the end of Y11! Still, I obviously want them to get their by June!
In that same lesson I gave out 'awards' for those students that had 'progressed' in some way from the January mock. The certificates/awards I gave out can be downloaded from my TES resources
here. I gave those students that had progressed from getting a D grade to a C an award, those that went from a C to a B and those students that had continually showed progress in both the mock papers and all tests we had completed in class. There were plenty of students that received certificates in these lessons and this in itself showed me that the class have made progress (over the year).
I hope this blog post has been of use to others in how I have tried to show progress that my classes are making. I feel that learning Mathematics is definitely a 'marathon and not a sprint'. Sometimes students don't understand a concept or topic for years and then all of a sudden 'click' with it and get it. Sometimes we have to go back in our learning and make mistakes in order to progress.
Whether we, as teachers, are able to show that our students are making progress every 20 minutes of our lessons is something I'm not sure can actually be done. Can we show that progress is being made over time - Yes!
This is how progress has been made in (some of) my classes and I hope I have shown how I know it.


 Say you want to print this 2nd page from this 3 page pdf document. You want it 2 sheets to a single page. So the page is landscape and you have the same page printed side by side (2 of the same sheet on a single piece of paper)
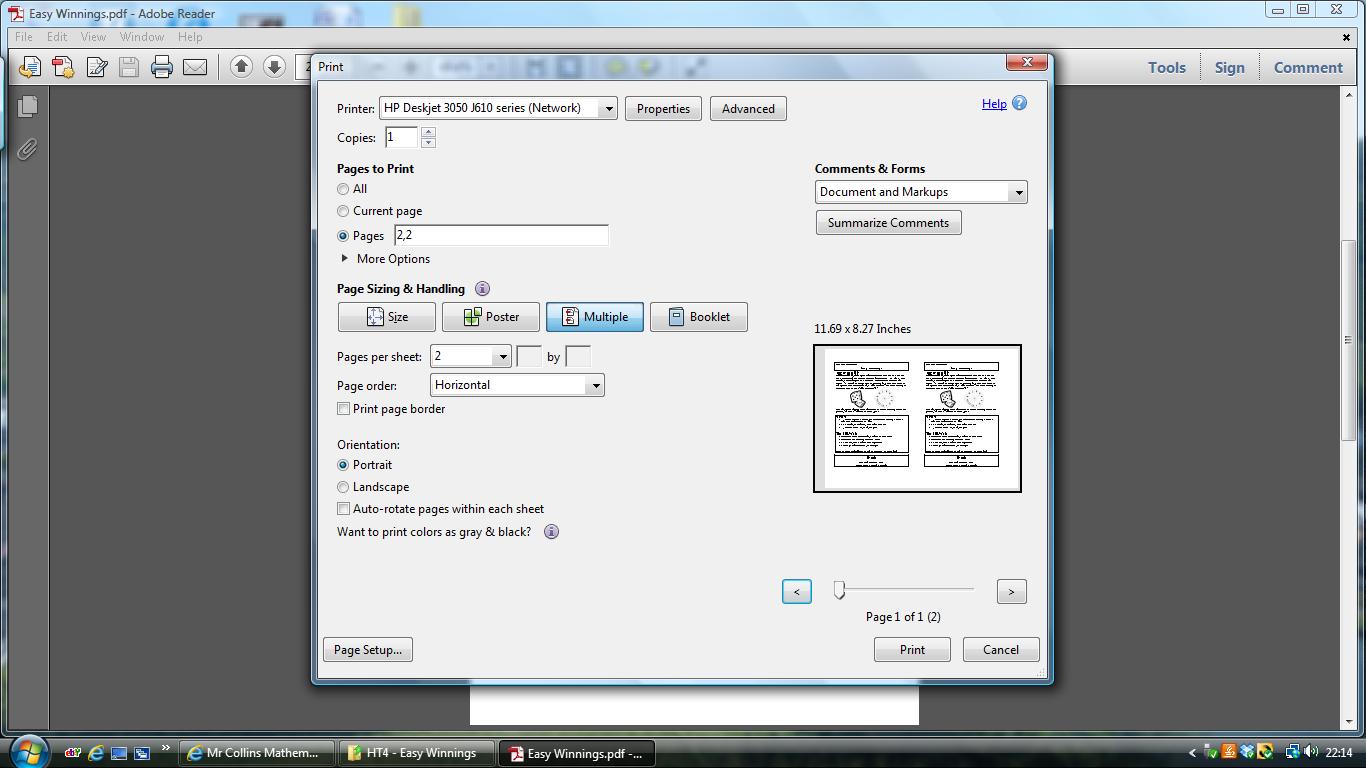


