What happens to 12 pizza pies at a school party? POOF, before you know it, they’ve disappeared.
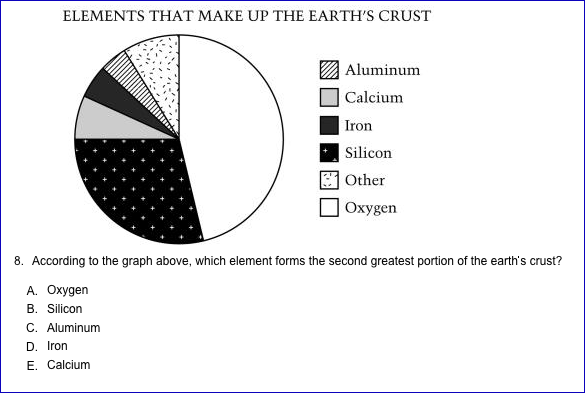
We begin, as we often do, with questions from the National Assessment of Educational Progress (``The Nation’s Report Card’’). In 2005, students were asked to study a pie chart (alternately called a circle graph): Read more »
Tidak ada komentar:
Posting Komentar